MACD
Moving Average Convergence/Divergence Oscillator
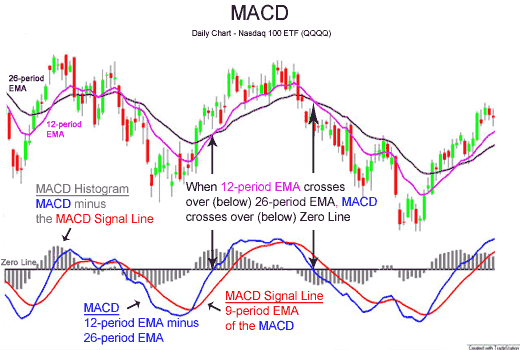
MACD is one of the simplest and most effective momentum indicators available. The MACD turns two trend-following indicators, moving averages, into a momentum oscillator by subtracting the longer moving average from the shorter moving average. As a result, the MACD offers the best of both worlds: trend following and momentum. The MACD fluctuates above and below the zero line as the moving averages converge, cross and diverge. Traders can look for signal line crossovers, center line crossovers and divergences to generate signals.
MACD can be pronounced as either “Mac-Dee” or “M-A-C-D.”
Calculation
MACD Line: (12-day EMA - 26-day EMA)

Signal Line: 9-day EMA of MACD Line

MACD Histogram: MACD Line - Signal Line
The MACD Line is the 12-day Exponential Moving Average (EMA) less the 26-day EMA. Closing prices are used for these moving averages. A 9-day EMA of the MACD Line is plotted with the indicator to act as a signal line and identify turns. The MACD Histogram represents the difference between MACD and its 9-day EMA, the Signal line. The histogram is positive when the MACD Line is above its Signal line and negative when the MACD Line is below its Signal line.
The values of 12, 26 and 9 are the typical setting used with the MACD, however other values can be substituted depending on your trading style and goals.
MACD line and Signal Line cross over generates a Buy and Sell Signals.
Let me tell you how this implemented in YouTrader
When you see a Call is
- "Buy" means MACD Line above Signal Line
- "Sell" means MACD Line below Signal Line
- "In Buy" means MACD Line Cross up Signal Line today or this week in weekly
- "In Sell" means MACD Line Cross down Signal Line today or this week in weekly
In YouTrader when you apply filter
"MACD - Today's Change in Call" that mean you are searching for "In Buy" and "In Sell"
"MACD - Yesterday's Change in Call" that mean you are searching for "In Buy" and "In Sell" generated yesterday.
"MACD - Call Buy" that mean you are searching for Call "Buy" Or "In Buy"
"MACD - Call Sell" that mean you are searching for Call "Sell" Or "In Sell"
YouTrader using a Standard Parameter 12, 26 & 9 to generate MACD Buy and Sell Signals. You don't have to act immediately based on Call. Along with call, what we carry is Call Price CP.
The day when Call generated "In Buy", we carry High of that day as Call Price (CP)
The day when Call is generated "In Sell", we carry Low of that day as Call Price (CP)
It's High of the week and Low of the week in Weekly.
Along with CP, we also carry CDays, that mean how many days this call is generated. This can call "Call Days". If CDays values is 20 then you can say Call (whatever Buy Or Sell) generated before 20 days. Similar its Cweeks in Weekly. I hope you understand the difference between Daily and Weekly analysis.
OK now how to read this all now. You know Call is just a indicator based on MACD and Signal Line Crossover. Some peoples jump based on call "In Buy" and "In Sell". Though it's start of trend but they carry their luck.
When Call is "Buy" and Price running above "CP" then we call it "Confirmed Buy"
When Call is "Sell" and Price running below "CP" then we call it "Confirmed Sell"
In YouTrader when you apply filter
"MACD - Today's Confirmed Call" that mean you are searching for "Buy" and Price Cross CP today in upward direction Or you are searching for "Sell" and Price Cross CP downward today.
"MACD - Yesterday's Confirmed Call" that mean you are searching for "Buy" and Price Cross CP yesterday in upward direction Or you are searching for "Sell" and Price Cross CP downward yesterday.
Column CP% is indicating whether price is above CP or below CP
Our experience saying we have to wait price cross CP after call generated to confirm the trend. You can back test this using Excel Charts.
I will update MACD UScript latter.
Happy Trading
--Author

