Saturday, July 18, 2020

YouTrader Working.

Apologies for the delay in posting here.

In recent days, I've received many emails asking if YouTrader is still working. Let me reassure you that YouTrader has never stopped, and users continue to use it daily. There were some server issues two years ago, but they lasted less than a week. Over the last two years, it hasn’t stopped for a single day.

Some antivirus programs may block YouTrader because it doesn’t have a digital certificate. I’ve been submitting false positives to antivirus websites, but occasionally, it still prevents YouTrader from running. To resolve this, go to your antivirus settings and exclude the YouTrader folder from scanning. This will allow YouTrader to run without interruptions.

Just search “How to Exclude folder in Antivirus” and mention the antivirus you’re using for detailed steps.

Hope this helps. Happy trading!

Thanks & Regards.

Wednesday, September 12, 2018

YouTrader Not Working

YouTrader Server issues.

YouTrader server hosting Bigrock facing major issues with Server and that affects thousands of hosting and website and so the one YouTrader.

Cannot move immediately with Other since data locked there. as soon as they solve the issues, will restore YouTrader service. It should not take now more time. This is the first time since 2011 that youtrader stopped for so long time. I hope this should resolve soon.


https://support.bigrock.com/index.php?/Knowledgebase/Article/View/4037/21/emergency-maintenance-on-windows-shared-hosting-servers--10th-sept-2018

Thank you for the patience and apologies for incontinence

Regards,


Sunday, November 05, 2017

Released new version 17.91
Whats New?
  1. Applied back color in youtrader will be applicable to all data sheets. You can change the back color using Columns >> Back Color
  2. Now you can change back color in Bar Charts as well. Option available in Menu
  3. New UScript variable “inIndex”. You can use this in Uscript in case you want to filter only Indexs like
    5WHA+ & inIndex
  4. In MiView, you can use Value “@%” if you want to calculate current market price difference in % with respect to previous column Value.
Happy Trading !!!

Saturday, September 23, 2017

YouTrader downloads not available for some technical issues.  We will back as soon as we fix it.

Thanks for the support.

Monday, March 13, 2017

Version 17.1 

Whats New

Intra Simulation
Now you can simulate market after hours and you can use all your strategy anytime in between.

How to use it?
  1. After market hours, mostly after 3:45PM, backfill YouTrader using Intra >> Backfill YouTrader menu.
  2. Once Backfilled, Click Intra >> Simulation
  3. Use Refresh menu to start refresh Or you can use Space Bar button to Refresh for one minute. Each refresh will refresh next one minute data.
  4. You can stop refresh any time and can apply your strategies till that time only.
  5. All Alerts will be working in Simulations.
  6. You Start Simulation from beginning using Intra >> Simulate Again.
  7. Use UFilters to check your strategies using Simulation
  8. In Auto running simulation, you can stop simulation by pressing Space Bar.
Changes in Following UScript Functions
Now YouTrader keep track of one minute data through out the day. In case you started YouTrader after market start then use Intra >> Backfill YouTrader to fill one minute data in YouTrader. Do this even you pause the YouTrader for more than one minute in running Market.

Click the Image Below and check the number of UScript functions affected because of this change. In case you are already using these functions then you have to make necessary changes in your UScript.


Happy Trading...

Sunday, December 11, 2016

New Version 16.9

Whats New
  1. Excel Feed. Please check its help for how to use.

  2. Free Filter merged with UScript Filter. Now you can write UScript & apply quickly like Free Filter earlier and save with name or without name in same Window if you want.

  3. New UFilter. In Running Market, Open UScript Filter and select the UScript that you want to watch continuously in another window. Get Alerts as soon as the Script added in Window that mean as soon as it applicable to selected UScript. It will give you at what time Script entered in Window and Price change % from the time it entered in Window

    Check this link for screen shot https://goo.gl/KvTI4m
Happy Trading !!!

Author, YouTrader

Tuesday, September 06, 2016

New Version 16.7

What's New

  1. Faster speed. optimized for faster update
  2. Added new functions in UScript. Price(n), MaxPrice(n1, n2), MinPrice(n1, n2). Check help for more details.
  3. Fixed few existing bugs like Notification windows open, bugs in UScript etc.
  4. Added 6 new scripts
    DELTACORP ALLCARGO ARCOTECH JBCHEPHARM JKTYRE MANAPPURAM

Happy Trading.

Monday, August 15, 2016

New Version 16.6

What's New

  1. Scan Script. Now you can create your strategy based on previous 200 rows in Excel Charts. That means if its Daily Chart then you can use any parameter of previous 200 days Like 1.Close > MaxHigh(2, 31) that mean Today Closed above last 30 days high. You can write Scan Script in Scan window. Access it using Scan >> Scanner - Indicator. Click Help button for more about Scan Script.

  2. In YouTrader UScript, you can use last 120 minutes to check price gain and volume gains Like PriceGain%(30) > 2 that mean to filter Scripts that gain more than 2% in last 30 minutes, Similar like VolGain%(60) > 50 that means Volume rise 50% in last 60 minutes. Please check UScript help for more details.

  3. Removed View menu and added View 1 to View 6 under Columns menu. Now you can change the columns profile on just pressing any Key 1 to 6.  Go to Columns >> Factory Reset for default profile set for Views.

  4. Added new menu "Intra". Under this menu, two sub menus available.

    Backfill (Max 120 Minutes) -  Use this to load 1 MIN Backfill in YouTrader to use last 120 minutes in UScript that described in Point #2. This may require if you using Minute based UScript and You opened YouTrader after market starts.

    Load BP & SP -  This moved from Scan menu.

  5. Added new column MFI (Money Flow Index) in Excel Chart. 

Happy Trading...

Monday, October 12, 2015

New Version 15.8

Dear Users,

Any upgrade in YouTrader automatically installed so far. But there was an issue in automatic upgrade in version 15.7 because of some changes. So new upgrade has to be done manually. I will make sure automatic upgrade works in future version's
  1. Go to Help » YouTrader - About and check version in About dialog box.
  2. If it is 15.7 then only follow steps below. Otherwise ignore this post
  3. Download YouTrader on Download Page
What's New in version.
  1. Fixed automatic upgrade and other issues. 
  2. Now all knowledge links will be available under Links menu. Try it you will like it.
  3. Tuned UScript. Added IIF, MAX and MIN functions. Will post about this soon.
Please send message in case you find any difficulties in upgrading. Version 15.7 will work only for few days and it's mandatory to upgrade new version.

Sorry for this inconvenience caused

Thank You !!!
Author - Ravindra Pandit.

Wednesday, October 07, 2015

MACD

Moving Average Convergence/Divergence Oscillator

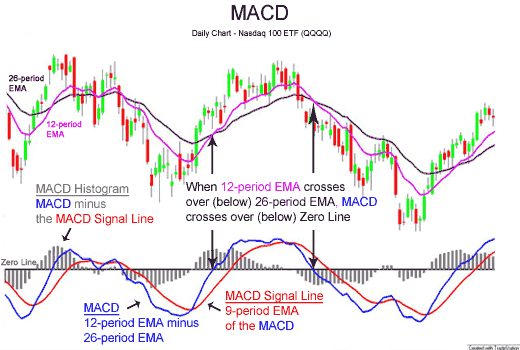
MACD is one of the simplest and most effective momentum indicators available. The MACD turns two trend-following indicators, moving averages, into a momentum oscillator by subtracting the longer moving average from the shorter moving average. As a result, the MACD offers the best of both worlds: trend following and momentum. The MACD fluctuates above and below the zero line as the moving averages converge, cross and diverge. Traders can look for signal line crossovers, center line crossovers and divergences to generate signals.

MACD can be pronounced as either “Mac-Dee” or “M-A-C-D.”

Calculation
MACD Line: (12-day EMA - 26-day EMA)

Signal Line: 9-day EMA of MACD Line

MACD Histogram: MACD Line - Signal Line
The MACD Line is the 12-day Exponential Moving Average (EMA) less the 26-day EMA. Closing prices are used for these moving averages. A 9-day EMA of the MACD Line is plotted with the indicator to act as a signal line and identify turns. The MACD Histogram represents the difference between MACD and its 9-day EMA, the Signal line. The histogram is positive when the MACD Line is above its Signal line and negative when the MACD Line is below its Signal line.
The values of 12, 26 and 9 are the typical setting used with the MACD, however other values can be substituted depending on your trading style and goals.


MACD line and Signal Line cross over generates a Buy and Sell Signals. 

Let me tell you how this implemented in YouTrader 

When you see a Call is 
  1. "Buy" means MACD Line above Signal Line
  2. "Sell" means MACD Line below Signal Line
  3. "In Buy" means MACD Line Cross up Signal Line today or this week in weekly
  4. "In Sell" means MACD Line Cross down Signal Line today or this week in weekly
In YouTrader when you apply filter 
"MACD - Today's Change in Call" that mean you are searching for "In Buy" and "In Sell"
"MACD - Yesterday's Change in Call" that mean you are searching for "In Buy" and "In Sell" generated yesterday.
"MACD - Call Buy" that mean you are searching for Call "Buy" Or "In Buy"
"MACD - Call Sell" that mean you are searching for Call "Sell" Or "In Sell"

YouTrader using a Standard Parameter 12, 26 & 9 to generate MACD Buy and Sell Signals. You don't have to act immediately based on Call.  Along with call, what we carry is Call Price CP. 

The day when Call generated "In Buy", we carry High of that day as Call Price (CP)
The day when Call is generated "In Sell", we carry Low of that day as Call Price (CP)

It's High of the week and Low of the week in Weekly.

Along with CP, we also carry CDays, that mean how many days this call is generated. This can call "Call Days". If CDays values is 20 then you can say Call (whatever Buy Or Sell) generated before 20 days. Similar its Cweeks in Weekly. I hope you understand the difference between Daily and Weekly analysis.

OK now how to read this all now.  You know Call is just a indicator based on MACD and Signal Line Crossover. Some peoples jump based on call "In Buy" and "In Sell". Though it's start of trend but they carry their luck.

When Call is "Buy" and Price running above "CP" then we call it "Confirmed Buy"
When Call is "Sell" and Price running below "CP" then we call it "Confirmed Sell"

In YouTrader when you apply filter 
"MACD - Today's Confirmed Call" that mean you are searching for "Buy" and Price Cross CP today in upward direction Or you are searching for "Sell" and Price Cross CP downward today.

"MACD - Yesterday's Confirmed Call" that mean you are searching for "Buy" and Price Cross CP yesterday in upward direction Or you are searching for "Sell" and Price Cross CP downward yesterday.

Column CP% is indicating whether price is above CP or below CP

Our experience saying we have to wait price cross CP after call generated to confirm the trend. You can back test this using Excel Charts.


I will update MACD UScript latter.

Happy Trading
--Author

Tuesday, October 06, 2015

View and Columns menus

YouTrader displaying data in number of columns and any columns you have ability to sort ascending or descending. Monitor screen width is limited and so you can not view all columns in single window. 

But you can distribute columns in number of views.  Default already provided but you can change it anytime. 

Select any view, go to Columns » Settings, Check Required Columns and remove check from other columns. Arrange the positions of checked columns up and down by using buttons or mouse drag and drop. Click OK and done.

This way you can arrange the columns in all different view. If you messed with the columns, you can anytime reset with original settings using Columns » Reset - factory option.

You can reorder the columns using mouse as well. You have to Save Columns Profile using Columns » Save - Columns Profile option

You can open the view using menu or keyboard shortcuts.  

To set the back color, use option Columns » Back color


Try similar in Excel charts
Blog Link http://goo.gl/YzEsXX

Monday, October 05, 2015

Watch Global Indexes in YouTrader

You can watch all important Global Indexes in Single Window.

Go to File » Global

A small window will appear with Indian Important Indexes, Asia, Europe and US indexes.


You can check 2MIN, 5MIN, 30MIN Bar Charts and Excel Charts for all indexes.

Happy Trading
--Author

http://goo.gl/lBxvdJ

Wednesday, September 30, 2015

Do you know you can stick your stock on your desktop screen with Live Prices?

Its not always you keep your eyes on stock price in any terminal. While trading you might check your email or writing document or browsing etc. 

How if such a small window always keep your eyes on Live stock price?


See I am wring this blog and I keep eye on my stock. http://i.imgur.com/MIdP1LN.png


Let me tell you how. 

Right click any stock in YouTrader main screen and select Open - Sticky from the menu.
This will open small sticky window with Stock Name, Current Price and Daily Change.

  1. You can move it anywhere using mouse. Click left button on it and move it and release button
  2. You can increase the size of the window by pressing + key
  3. You can decrease the size of the window by pressing - key
  4. You can align text Horizontally by pressing "H" key
  5. You can align back to Vertically by pressing "V" key
  6. You can close this window by pressing "X" key or just by double click on it

Happy Trading
--Author

Tuesday, September 29, 2015

How to check Daily and Weekly Advances (Greens) in YouTrader

In Last release I have added one important indicator, daily and weekly advances shares in YouTrader. This value display in percentage like 10% or 44.6% that mean these number of stocks are in Greens from all stocks available in YouTrader. For example there are 160 stocks in YouTrader and if advances  (Greens) count is 16 then this number should be 10%.


Here 8.13% greens in Daily and 12.50% greens in Weekly

What it indicates? It tells you overall market mood and trend, If you are intraday trader then you should always check this figures.  If number if greater than 70% you should go for longs and if it is less than 30% you should go for shorts. 

Happy Trading
--Author

Monday, September 28, 2015

New version released 15.7

What's New 
  1. New Splash Screen matching with website and Facebook page
  2. Daily and Weekly Advances (Greens) stocks in Percentage on status bar
    http://i.imgur.com/nMO0BYQ.png
  3. Fixed some existing issues. 
Amibroker Users - Please Back-fill every day for faster back-fills next day. If you want to adjust Closes, Back-fill after EOD data updated on YouTrader Server. 

How to identify if EOD data updated on YouTrader Server?

Go to Help >> YouTrader - Daily Files Update Statu
s. Check EOD Files date and if it is after Market close date time then consider it as EOD files update.  
http://i.imgur.com/Wly6TDh.png

Otherwise while restart YouTrader if it popup message "New Files are available there on YouTrader Server" consider it as EOD files update

Happy Trading
-- Author

Thursday, September 24, 2015

What is BP & SP?

I used these terms for Buy Price and Sell Price and should use only for Intraday. Market is usually volatile in first half hours or till 10AM. Almost the time your trades before 10AM are not in your favor.

So you decide when you want to initiate your trade after 9:45 and load BP & SP using Scan >> Load – Intra BP & SP. Most of the time BP nothing but High till that time and SP nothing but Low till that time. Wait for half hour from Time selected and then track BP & SP.

If price remain above BP that mean its bullish one and if price remain below SP that means its bearish one.

Add BP% and SP% using Column Settings if it’s not there and sort these columns and find what those stocks above BP and below SP.

You can filter out using UScript BP+ Or SP-

Get it notified. Go to Notification >> Indicators – Settings and select
Alert & Notify BP – Price Cross North
Alert & Notify SP – Price Cross South
You can make UScript Alert in combination with Other Indicators like
JCN(BP) & Low < Close
JCN(BP) & 5WMA+++
JCS(SP) & High > BP
You can combine any possible combinations with cross over.

-Author

Wednesday, September 23, 2015

Last Month High and Low (LMH & LML) 

Have you ever tracked LMH & LML? These indicators very important finding trend of the stock price

Its very simple tracking these indicators in YouTrader.  Check columns LMH and LML in YouTrader. If not in view, add those from Columns >> Settings

Add their Percentage columns as well LMH% and LML%, These columns can quickly tells you if price above LMH Or below LML

If the LMH% is positive or green that mean price running above LMH and if LML% is negative or red then price running below LML. You can quickly sort out these columns

Check this http://i.imgur.com/HdKLEWr.png

No wonder you need filter on these columns right? You can filter out it using UScript. Press F9. Add following scripts and press enter and see the magic

LMH+ 'Price Cross LMH today
LMH++ 'Price Cross LMH sometime this week
LMH+++ 'Price above LMH irrespective when it cross in month

http://i.imgur.com/ULFn8N1.png

LML- 'Price Cross LML today
LML-- 'Price Cross LML sometime this week
LML--- 'Price below LML irrespective when it cross in month

Do you want it Alert as soon as price cross these indicators? Create UScript Alert using following scripts

JCN(LMH) Or JCS(LML)

JCN stands for Just Cross North and JCS stands for Just Cross South

Try similar for Last week High (LWH) and Last Week Low (LWL)

--Author

Tuesday, September 22, 2015

Do you want it Alert as soon as rise in Volume?

Before this I would like to introduce few indicators in YouTrader related to Volume
  1. Volume, this displays the today's volume in Lakh's. So if is it 10.5 that mean actual volume is 1050000. If you are watching Weekly File then its Weekly Volume 
  2. LDV, it's Last Day Volume in Lakh's. 
  3. LDV%, It's Percentage difference between Volume and LDV.  If LDV is 10 and Volume is 2 that mean LDV% is 20%. That mean it filled 20% of LDV so far. If its 100% that mean it Today's Volume = LDV. More than 100% that mean it has more volume compare to Last Day
  4. 5DVMA, It's 5 Day Volume Moving Average. 
  5. 5DVMA%, again its Percentage difference between Volume and 5DVMA. 

Now to check where the today's volume with respect to LDV, 

  1. Go to View >> Volume Indicators and Sort out LDV% by clicking LDV% header. Add the columns using Columns >> Settings if columns not there in View
    http://i.imgur.com/y3UTXTg.png
  2. Use USCript to filter out like "LDV% >= 200", that mean double the volume than previous day
You can get alert as soon as it rise defined volume 
  1. Go to Alerts >> Add New - UScript Alert
  2. Add any readable message like "Volume Cross 200%"
  3. Add UScript "DVC(200)". DVC Stands for Daily Volume Cross
  4. Click OK.
You are done with Alert. Now in Live Market, as soon as volume cross 200% it will popup Alert Message "Volume Cross 200%".  http://i.imgur.com/bupOBnz.png


You can OFF this alert using Alerts >> Alert Manager - UScript. Check Specific Alert and Go to File >> Switch OFF. http://i.imgur.com/5jGv9Me.png

OFF Alerts will not executed till the time you ON it in similar way.

This was all for daily, You can do the similar things in Weekly using LWV, LWV%, 5WVMA, 5WVMA%, WVC (Weekly Volume Corss) for UAlert only

-- Author

Monday, September 21, 2015

Pivot Points

A technical analysis indicator used to determine the overall trend of the market over different time frames. The pivot point itself is simply the average of the high, low and closing prices from the previous trading day. On the subsequent day, trading above the pivot point is thought to indicate ongoing bullish sentiment, while trading below the pivot point indicates bearish sentiment. 

A pivot point analysis is often used in conjunction with calculating support and resistance levels, similar to a trend line analysis. In a pivot point analysis, the first support and resistance levels are calculated by using the width of the trading range between the pivot point and either the high or low prices of the previous day. The second support and resistance levels are calculated using the full width between the high and low prices of the previous day.

Using YouTrader, you don't have to calculate anything. Columns P, R1, R2, S1 & S2 are pivot, resistance1resistance2support1 support2 respectively.  Same are available in 2MIN chart with prefix "d" like dP, dR1 etc and for weekly prefix with "w" like wP, wR1 etc.

Go to View >> Pivot Points. All these columns available there. If not, add it through Columns >> Settings.

I started my trading using these points first and even I started writing YouTrader for Pivot Points initially.  I always verify these indicators before initiating any trade. 


You can quickly sort out columns by clicking respective Columns Header  in YouTrader  http://i.imgur.com/BD6Nk5D.png

You can filter out quickly. Go to Filter >> Open http://i.imgur.com/eEAriXO.png

You can use Notifications feature in YouTrader to quickly get notification as soon as price cross these indicators. Go to Notifications >> Indicator Settings http://i.imgur.com/YalJQzB.png

Or you can use UScript for filter like R1+, R2+ R1- etc. Go to Filter >> UScript - Free Filter http://i.imgur.com/WYd7Mcm.png

You can make UScript alert in combination with other indicators available in YouTrader. Like if you want Alert when price cross R1 and Price already above 5WMA. here it is 

Go to Alert >> UScript Alert and add script [JCN(R1) & 5WMA+++] without square bracket

It will alert as soon as price cross R1 for the stocks already above 5WMA
http://i.imgur.com/yB1uPkW.png

-- Author

Wednesday, September 16, 2015

Quickly sort out Stocks with Price near High and Price near Low


For Intraday Near High.
  1. Go to File >> Daily. This will open daily analysis sheet
  2. Go to View >> Open Indicators. Make sure HP% Column visible on screen otherwise add those columns from Columns >> Settings
  3. Click HP% Column Header. This will sort this columns in descending order, if not again click HP% Header.
  4. If the stock near 0% that mean Price near High

Check this http://i.imgur.com/kJiVzDZ.png

For Intraday Near Low
  1. Go to File >> Daily. This will open daily analysis sheet
  2. Go to View >> Open Indicators. Make sure LP% Columns visible on screen otherwise add those columns from Columns >> Settings
  3. Click LP% Column Header twice. This will sort this columns in ascending order, if not again click LP% Header.
  4. If the stock near 0% that mean Price near Low.

check this http://i.imgur.com/d7hskwH.png

Want to try this with UScript?
  1. Go to Filter >> UScript - Free Filter Or Just Press key F9
  2. In Free Filter window, enter HP% >= -0.2 
  3. This will filter out all stock those are near 0.2% near High
  1. Go to Filter >> UScript - Free Filter Or Just Press key F9
  2. In Free Filter window, enter LP% <= -0.2 
  3. This will filter out all stock those are near 0.2% near Low

Now you know this for Intraday. What about Weekly? 
  1. Go to File >> Weekly and try the same again
  2. Use wHP% and wLP% in UScript if you like to filter using UScript.

OK what about Near High and Near Low for last 25 days?
  1. Go to History >> 25 days...
  2. Sort out HP% & LP% same as daily and weekly.
  3. Try this for other days
Sorry No UScript in History.

--Author
www.youtrader.in

Follow for such updates in Email.